Lab 11: Climate Change
Part One
On the second page is graph of Antarctic ice core data taken up until 1999. The x-axis shows the years before present (BP), based on depth of ice, and the y-axis shows the amount of carbon dioxide (CO2) in parts per million by volume (ppmv) and the temperature fluctuation in degrees Celsius. Use this graph, information discussed in class, and relative outside sources to answer the questions below.
a) When was the last ice age?
b) What was the temperature difference in Antarctica at that time with respect to the present temperature?
c) What was the atmospheric CO2 concentration during the last ice age?
slowly? When it warms is it fast or slow?
warming period that followed the last ice age. (Show your work)
Part Two
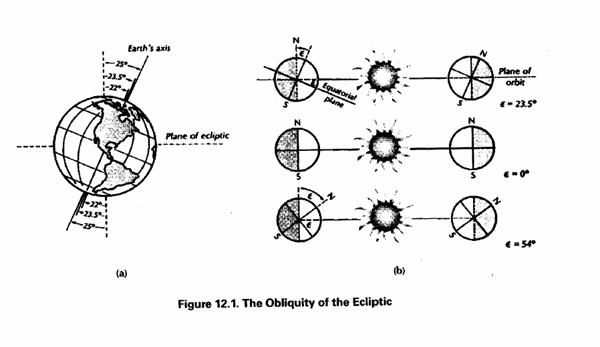
Refer to Figure 12.1 and the text, chapter 19, for the following questions regarding the obliquity of the ecliptic.
1. Within a 41,000-year cycle, what is the range of the earth’s axial tilt?
2. Describe the climatic conditions in the Northern and Southern Hemispheres if the axial tilt were 0 degrees.
3. Describe the climatic conditions in the Northern and Southern Hemispheres if the axial tilt were 54 degrees.
Part Three
List three human activities that have contributed to climate change and describe how they affect the climate (use the back of page if necessary).