Lab 2 Part A
Go to the class webpage and choose ‘Links’, then ‘VERY COOL LAB ACTIVITIES’. Click on Lab Activity #7, “Vertical Profiles of Temperature and Salinity in the Ocean”.
Follow the link provided http://www.pmel.noaa.gov
Click on the ‘Data’ pulldown menu and choose ‘NOAA Ship KA’IMIMOANA’
Click on ‘Research’, then ‘CTD Data’.
Most of these data were collected by the NOAA research ship Ka'imimoana, which was designed and is dedicated to
maintaining an array of buoys in the tropical
(1) In the first column of the data selection array, select "GP4-99-KA", which, shows a map of the two meridional transects along which the ship collected data in August, 1999. As you can tell from the data array, the temperature and salinity data were collected along 165°E and 180°W longitudes.
(a) In what part of the equatorial
(b) Examine the temperature and salinity data along 165°E. What are the main features of each and how deep are they, or what is the range of depths at which you see them? Do temperature and salinity profiles have the same structure? Pose hypotheses that might account for the main features of each, if possible based on information provided in assigned reading.
(c) Are there differences between Northern and Southern Hemispheres? Pose a hypothesis about what might account for the differences, based if possible on information provided previously in class or in assigned reading.
(2) Repeat (1) (a)-(c) for the September 1996
transect along 125°W and the October 2000 transect along 110°W. What
differences do you see, if any, between the different
parts of the equatorial
Climate Change Lab #2b
GEO 302C

|
|
Situation Already, the Southern Oscillation Index (SOI) is showing monthly magnitudes greater than -24. Daily values reached as high as -85 in June 1997. The latest SOI values are here. During the 1982-83 El Niño, monthly values peaked at -35.7. SOI data since 1900 are available. By June 1997, water temperatures in parts of the eastern Pacific were more than 4°C higher than normal, the warmest temperatures recorded in that area since August, 1983. This departure from normal temperature is called an "anomaly." As you proceed further into your investigation of the El Niño problem, you will see that much of the data is presented in terms of anomalies. This presentation tends to be more useful than the actual data, since the developing conditions are distinguished from the normal. (Information on how anomalies are computed for sea surface temperatures is included here.) As the new El Niño develops, an anomaly is also taking place in the winds. For only the second time since November 1982, westerly trade winds replaced easterlies in the Pacific from 160E to 100W longitude.
If the wind has an easterly component, it is shown as a negative on the chart above. A westerly component (anomalous situation) is depicted as a positive value. The value of 850 hPa indicates theses winds were measured at an atmospheric pressure of 850 millibars, about 5000 feet above the sea's surface. Convection had decreased in the western Pacific but increased near the dateline. Faced with a rapidly changing situation,
the director of the World Bank and the president of the Northern Insurance
Negotiating Organization (Nino) have approached your group of environmental
consultants for advice in forecasting the environmental conditions and
economic impact that will accompany this developing El Niño.
They want to know not only what can be expected from this El Niño with regard to weather, fisheries, and crops, but
also how its impact can be softened. El Nino Reference Page: http://davem2.cotf.edu/ete/modules/elnino/elnino.html http://www.pmel.noaa.gov/tao/elnino/nino-home.html El Nino Lab Page: http://davem2.cotf.edu/ete/modules/elnino/crsituation.html |

El Nino: Supplemental Questions for Study
GEO 302C Name:__________________
Related Links (if needed):
http://www.pmel.noaa.gov/tao/elnino/faq.html
http://topex-www.jpl.nasa.gov/science/enso97/el_nino_1997.html
http://ww2010.atmos.uiuc.edu/(Gh)/guides/mtr/eln/home.rxml
http://davem2.cotf.edu/ete/modules/elnino/crsituation.html
1.What is El Nino and how
does it affect the normal pattern of oceanic circulation in the
2.When was the most recent notable El
Nino event? How long did
it
last? What longer term phenomenon is currently dominant in the
http://topex-www.jpl.nasa.gov/science/enso97/el_nino_1997.html
3. Scientists installed a series
of buoys in the
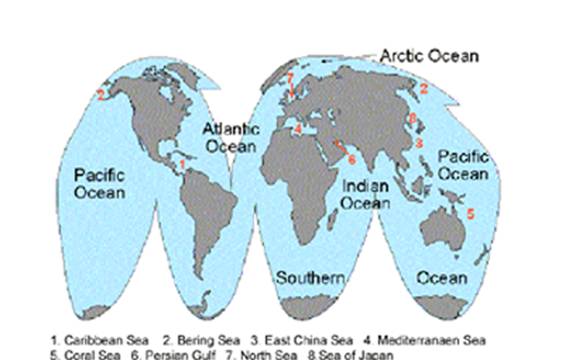
4.Draw the maximum geographic extent of El Nino on the map below:
5.
El Nino is often linked to upwelling of cold
ocean waters. Where does this upwelling occur and what impact does El
Nino have on it?
6. How has the El Nino
Event affected weather patterns in a)
The majority of this Lab Exercise
was written by Dr. David McConnell, Associate Professor of Geology at the