Lab #5
Week of
1. KEY CONCEPTS:
(Discussed in Lectures for Wednesday, January 19 and Friday, January
21)
- Energy balance equation
- Radiation: Long and short-wave
- Albedo and reflectivity of surface (short-wave radiation)
- Equilibrium temperature
2. POP QUIZ:
Relax – no pop quiz this week.
3. DAISYWORLD EXPERIMENT:
3.1 Background: This simple (zero-dimensional) computer model is designed to illustrate Lovelock's Gaia Hypothesis, which views the Earth as a living, self‑regulating entity. While evolving, life forms on earth modulate their environment (temperature, etc.). Please access the model for this lab at: http://www.geo.utexas.edu/courses/387h/daisy.html In this web page, click on the link to daisy.html |
Serial # |
Programs |
Description |
Topics/Problems* |
|
1. |
Daisy Model |
This Program models a planet Daisyworld. Daisyworld is an artificial world having a very simple biota which is specifically designed to display the characteristics in which we are interested - namely, close coupling of the biota and the global environment (McGuffie and Henderson-Sellers,1997). |
More information can be found athttp://www.acad.carleton.edu/curricular/GEOL/DaveSTELLA/Daisyworld/gaia.htm This model describes an imaginary planet called Daisyworld (see figure).
|
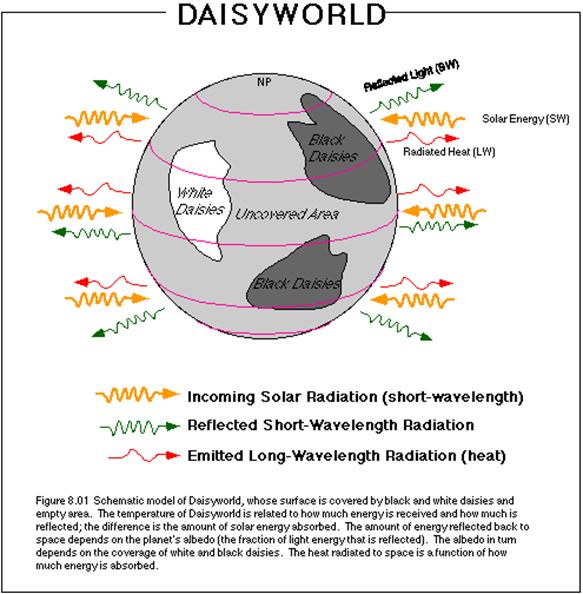
Daisyworld is a very simple planet that has only two species of life on its surface -- white and black daisies. The planet is assumed to be well-watered, with all rain falling at night so that the days are cloudless. The atmospheric water vapor and CO2 are assumed to remain constant, so that the greenhouse of the planet does not change. The key aspect of Daisyworld is that the two types of daisies have different colors and thus different albedos. In this way, the daisies can alter the temperature of the surface (Te, or equilibrium temperature of Lab #3) where they are growing.
3.2 Experiments: Remember that initially, there are no daisies on the planet (just a few seeds) and the sun's luminosity (compared to present, which is 1) is very low (say, 0.6). 1. What will happen at first? Will the both types of daisies start to grow right away? Or just one type?
HINT: How will the albedo of the black/white daisies affect temperature? 2. What do we need to know in order to figure out whether or not the daisies will grow? We need to know the local temperature for each daisy (and the temperature that each daisy can grow in). If it is too cold, daisies cannot grow. (if it is too hot, daisies cannot grow either.)
3.2.1. Running the Daisyworld Model Set and do not change the following parameters in the web model: · Black albedo at 0.25,
· White albedo at 0.75,
· Background (or bare soil) albedo 0.50, and
· Fertile fraction at 1.0 (means all the soil has adequate nutrients for growth).
SEE SCREEN CAPTURE ON NEXT PAGE FOR CLARIFICATION! |
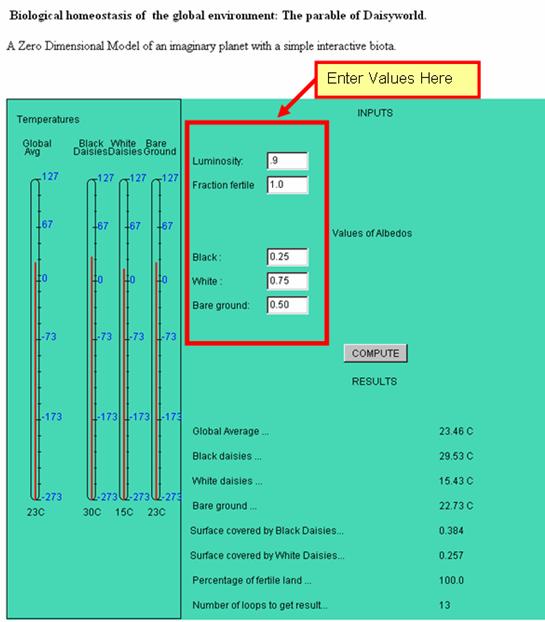
Run the model several times and vary luminosity (i.e. different sun strengths) from 0.6 to 1.6 for each increment of 0.05 (i.e., 0.60, 0.65, 0.70, etc.) and run the model by clicking "Compute". For each model run, write down the following values: · Averaged planetary temperature,
· Black daisy area, and
· White daisy area.
Remember, the intensity of the sun goes up and down over geologic time – right now it is 1,367 W/m2 (the Solar Constant).3.2.2 Running the Daisyworld Model and Varying Albedos In this experiment, modify the Daisies albedos, first to more extreme values (0.05 and 0.95) and then to more moderate values (0.4 and 0.6). Be sure to make some careful predictions before running these models. 3.3 Homework Assignment: You may seriously consider constructing your data table (A) and graphs (B and C) using Microsoft Excel or equivalent spreadsheet / graphing program. See your TA if you would like to learn how to use Excel! A. Turn in table of your data (luminosity, averaged planetary temperature, black daisy area, and white daisy area). Also state values of the parameters you used (i.e. black albedo, white albedo, background albedo, and fertile fraction).
B. Plot the x-axis for the luminosity from 0.6 to 1.6, and the y‑axis for the black daisy area and the white daisy area. Comment on how they grow in response to the luminosity changes.
C. Plot another graph with the x-axis for luminosity and y-axis for the averaged planetary temperature. Comment on what happens.
D. What happened when you modified the albedos of the Daisies?