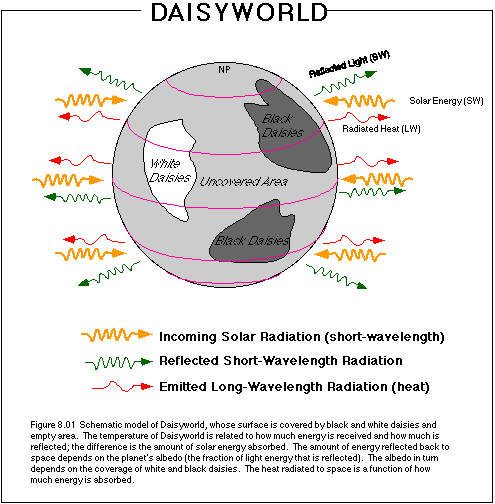
DAISY MODEL
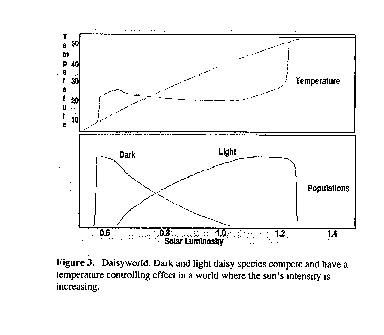
| ( i ). Can you reproduce panel d in Watson and Lovelock's figure 1
(or figure 3 by clicking on
an article here)? To do
this, you will need to set the fertile fraction as 1, retain the albedos
the program offers but alter the solar luminosity fraction from 0.6 to 1.6 in
steps. At each step jot down the global temperature and the areas of black and
white daisies. ( i i ). Do you understand why the almost constant temperature you calculate over a large range of luminosity changes is said to be due to biological homeostasis? What will happen as the planet begins to warm, driven by the increasing energy output of the sun? Which type of daisy will begin to grow first? What will happen to the planetary temperature when the first daisies begin to grow? How will that change in the planetary temperature change the growth of the daisies. Will both types of daisies grow during the same time period? If so, what will be their combined effect on the planetary temperature? It will be instructive to plot the three area reservoirs on one graph, and the average planetary temperature and the temperature of the "bare" planet on another graph. Various other graphs will be necessary to fully understand what is going on to drive the observed behavior. |
 |
( iii ) Experiment with changing abledos. Initially, the black albedo is set at 0.25, while the white albedo is 0.75. In your experiment, modify these albedos, first to more extreme values (.05 and .95) and then to more moderate values (.4 and .6). Be sure to make some careful predictions before running these models.
( iv ) Can you reproduce the other panels in their figure 1?
( v ). Is the dependence of the growth rate of the daisies as a function of temperature [R= 1-0.003265(22.5-T)2 ] valid for all life?
( vi ). Experiment with changing growth rate.
a) First, alter the optimum temperature for the daisies' growth, which is initially set at 22.5°, to 15°. To do this, alter the equations for the growth factors, replacing 22.5 with 15. As always, make predictions before running the model.
b) Next, restore the optimum temperature to 22.5 and then reduce the range of temperatures that the daisies can tolerate. Initially, the daisies can grow in temperatures ranging from 5 to 40. Now restrict the range so that the daisies grow only between 18 and 27; this can be done by replacing the 0.003265 with 0.05 in the equations for the growth factors. As always, make predictions before running the model.
( vii ). Does life exhibit other controlling feedbacks, for example with the atmospheric carbon dioxide?
( viii ). Must all non-living feedbacks be 'disruptive' to the biological homeostasis or are there powerful feedbacks in environments without life?
( ix ). Experiment with plagues. This experiment explores the resilience of Daisyworld by programming a set of plagues into the model. These plagues decimate the populations periodically for brief periods. An interesting question here is whether or not the daisies will be able to recover fast enough to return the planetary temperature to the "comfort zone".
To implement this change, replace the death rate 0.3 with 1.0 periodically for brief periods.
Run the model as before, after making a prediction about what will happen. Are all of the plagues equal in magnitude (in terms of area lost as a result of the deaths)? Does each plague result in the same kind and magnitude of temperature change? Does the system recover from each plague? What determines whether or not the planet recovers from a plague?.
Watson, A.J. and Lovelock, J.E., 1983: Biological homeostasis of the global environment: the parable of Daisyworld, Tellus, 35, 285-288.
Additional Readings:
Lovelock, J.E., 1988, The Ages of Gaia, W.W. Norton and Co., New York, 252pp.
McGuffie, K. and Henderson-Sellers, A., 1997: A Climate Modeling Primer, John Wiley & Sons, New York, 253pp.
Last updated on 10/13/09 02:22 PM by Zong-Liang Yang