|
5.0 Summary of Part I (Lab 4)
In Lab 4 you created a database, a feature
dataset and a feature class that now contain nearly all of the
elements of your map. What is lacking is a "Rock
Units" feature class, with polygons that can be filled with
colors/patterns to symbolize the geological units. In
the final steps of Lab 4, you digitized the outline of the
rock units, stored the results in a GeoLines_XXX
(alias "Contacts and Faults" ) feature class and created a topology. With topology rules you specified
that lines can not overlap or cross ("intersect") other lines or themselves, and
that they can not "dangle", i.e. starting and ending vertices
of such lines must be precisely coincident with other
lines.
By "validating" the topology,
you had the software find all of the places on your map where
the rules are broken. These places are now marked so that they can be fixed by editing
with special tools, which are explained
below. Such editing is essential if we want the software
to create the rock unit polygons correctly, without errors.
Before starting, make copies of your
GeoLines_XXX feature class using ArcCatalog.
Name the copies with a "2" or "3" at the end of the file
name and store them in the Geology feature dataset. If editing goes badly, you
can always start over with a fresh copy and new topology.
5.1 Fixing Topology Errors
Described below are automated and manual techniques for
removing errors. An error is a
violation of a specific topology rule. Dangle
errors are where lines "undershoot" or "overshoot"
a line they where supposed to meet.
Such errors are classified as "Point Errors" for display,
because they can be fixed by moving or eliminating one (or a
few) vertices. Intersection errors are where a single line loops
back and crosses itself before continuing on.
These are also classified as point errors.
Overlap errors are where lines (or parts of lines) were accidentally digitized
twice. These are classified as "Line
Errors" and display as pink lines.
ArcGIS Help on these
subjects can be found by searching "Finding Topology Errors",
"About Fixing Topology Errors"
and "Fixing Topology Errors". Some of the same
material is covered in "Chapter 4: Editing Topology" in
"Editing in ArcMap" in the digital books folder.
Open ArcMap with a new, empty document. Load the "Geology_Topology" feature
class. Answer "Yes" to the question, which then adds
the GeoLines_XXX feature class.
With the exception of the "Contacts and Faults" symbology,
your map should display errors like the one below with, of course,
different errors.
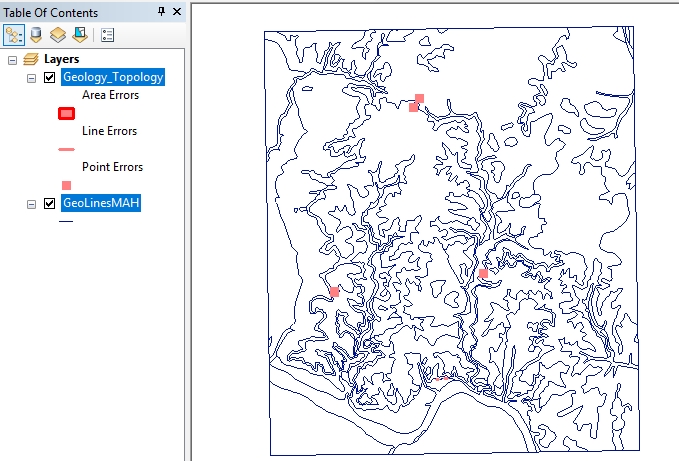
The map above shows one "Line
Error" (pink line near river bend), where a contact
(or part of a contact)
was accidentally digitized twice, and four
"Point Errors" where
dangles or self intersections exist. These
are the errors in the Summary at the end of Lab 4.
Let's fix the errors.
-
If not already turned on, turn on the Editing
toolbar (click the button
 that does so on the ArcMap
standard toolbar) that does so on the ArcMap
standard toolbar)
-
Turn on the Topology toolbar
(Customize>Toolbars>Topology, check the Topology box)
-
"Start Editing" (from the Editor toolbar
drop-down menu choose "Start Editing")
-
On the Topology toolbar, click the "Select
Topology" button
 ,
choose "Geodatabase_Topology" ,
choose "Geodatabase_Topology"
-
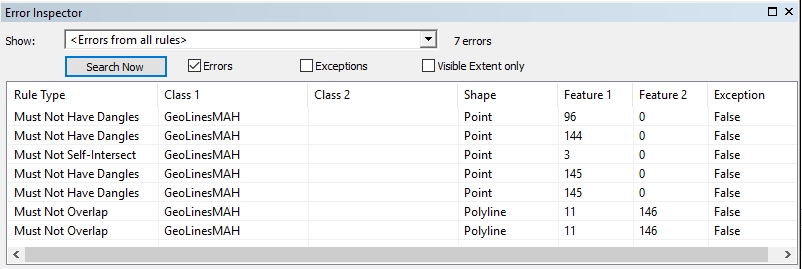
Open the "Error Inspector"
window by clicking on the Error Inspector tool
 .
Populate the window by clicking "Search Now" to see the
errors listed, as below. .
Populate the window by clicking "Search Now" to see the
errors listed, as below.
 We want to use automated tools to fix as many of the errors
as possible. To do so, we will use the "Fix Topology
Error" tool .
-
Click the "Fix Topology Error" tool
 .
The cursor changes to look like that on the tool button. .
The cursor changes to look like that on the tool button.
-
To fix a (poly)Line Error (pink line):
-
click the line error with the Fix Topology
Error tool; the color of the line changes from pink to
black. The error now appears in the Error Inspector,
which shows the rule being violated (i.e. "Must Not Overlap") and other information about the
line feature. Overlapping
lines errors can be fixed by "subtracting" one of the lines
away.
-
Right-click on
a now black (selected) line or right click on the listed error in the
Error Inspector and select "Subtract".
A Subtract window opens.
-
In the Subtract window, choose the line
from which the error will be subtracted (you
can see which line is which by clicking on the line number
in the Subtract window; the line is briefly highlighted
on the screen) and click OK. This removes the
duplicate line, or the portion of the line that overlaps another line feature.
Be careful - don't delete the wrong line!
-
You can undo individual
changes by typing Ctrl-Z or by using the Undo tool
 on the ArcMap standard toolbar.
-
To check your fix, click
the "Validate Topology in Current Extent" tool
 . .
-
SAVE EDITS
-
To fix a Point Error
(pink square:)
There are two types of Point Errors: Dangle errors and Self Intersect errors.
We will deal with Dangle errors first, of which there are
two types; 1) those where a line was suppose to meet
another line and 2) those where the line was suppose
to close on itself (have coincident starting and ending
vertices). Before we do so consider that some
dangles may be permitted, for example lines for faults are
permitted to extend beyond where they meet another line.
So, before fixing any dangle errors, look at the screen
and identify dangle error that are not, in fact, error and
mark them as "Exceptions" in the Error Inspector".
This also can be done with a right click on the pink dangle
error indicator.
-
To fix a Dangle error where a line was
suppose to meet another line (as in the figure below):
We first need to know whether the dangle is an "undershoot" and
the line needs to be "extended" (as shown below), or whether it is an
"overshoot" and needs to be "trimmed".

-
To determine whether a line needs to be
trimmed or extended, right-click the pink point error in question
and select "Zoom to", then right-click on "Layers" in the
TOC and select "Reference Scale">Set Reference Scale.
-
To extend or trim, right-click the now black
square (the once pink error marker),
select either "Extend..." or Trim...", and type in a maximum
distance (in meters) between the line and the feature you
want it to meet. If your first attempt doesn't work,
try again with a longer distance.
-
Another (but less
predictable) way to fix such errors is to select "Snap..." from the right-click menu and then give a distance
to the nearest line feature you wish to snap to. If no
line is found within that distance, no snapping occurs; try
again with a longer distance. "Snap..." will
not snap dangle errors to an end of the same feature (see below for such fixes),
only to a different line feature in the same feature class.
It searches first for an endpoint to snap to; if none is
found within the distance it searches for vertices, and then
finally for the nearest line.
-
To check your fix, click
the "Validate Topology in Current Extent" tool
.
-
You can undo individual
changes by typing Ctrl-Z or by using the Undo tool
on the ArcMap standard toolbar.
-
If you zoom out and the pink errors no longer
show, reset the Reference Scale, as described above.
-
SAVE EDITS.
-
To fix a Dangle error
where a line was suppose to close on itself (as in the
figure below):
The "Extend...", "Trim..." and "Snap..." tools will not work
in these cases and the Dangle error must be fixed manually.

-
If not already set, turn
on "Vertex" and "End" snapping (Snapping
toolbar).
-
On the Topology toolbar click the Topology Edit tool
 . .
-
With the Topology Edit
tool selected, click the line you wish to fix (not the pink
error marker, but the line that includes it). The
vertices on the line should now appear as green squares, and
the end node as a red square, as in the figure below.

-
Move the cursor to the end
node (red square); it changes from an open arrowhead to an
open square with 4 enclosing black arrowheads when directly
over the node.
-
With the cursor now
changed to the open square shape, left-click, hold and drag
the red node to the beginning of the line, where it should
snap to a green vertex. Release the click.

-
You can undo
individual changes by typing Ctrl-Z or by using the Undo tool
on the ArcMap standard toolbar.
-
If you zoom out and the pink errors no longer
show, reset the Reference Scale, as described above.
-
SAVE EDITS.
-
To check your
fix, click the "Validate Topology in Current Extent" tool
.
-
To fix a Self Intersect point error
(shown below):

-
click
the error with the Fix Topology Error tool; the color of the
point changes from pink to black.
-
Right-click the now black (once pink) point and select "Simplify", which
removes self overlapping line segments.
-
If this does not work
(e.g. the Simplify tool is unavailable), move the vertices
in the area of intersection to remove the
self intersection using the
techniques described above in fix 2.
-
You can undo individual
changes by typing Ctrl-Z or by using the Undo tool
on the ArcMap standard toolbar.
-
To check your fix, click
the "Validate Topology in Current Extent" tool
.
-
If you zoom out and the pink errors no longer
show, reset the Reference Scale, as described above.
-
SAVE EDITS.
Once you've made fixes,
you can "Validate" the topology again to see if the
fixes worked. Two tools on the Topology toolbar are
there to do so; the icons with black check marks.
Using these tools, you can validate within a specified area
or
within the "current extent" (the area visible on the
screen).
-
Work your way through the errors, one-by-one,
fixing them all.
-
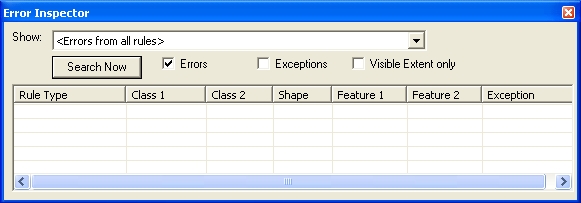
Validate the topology as
you go, until no errors are left. An easy way to check
for remaining errors is to click the "Search Now" button in
the Error Inspector, with only the "Errors" box checked and
the "Show:" field set to "<Errors from all rules>", as shown
below (with no remaining errors!).
-
SAVE EDITS.
-
"Stop Editing" (Editor
Toolbar drop-down menu, "Stop Editing").
-
Ensure that you have fixed all topology
errors before proceeding by Zooming to the Geology_Topology
layer to see a
screen free of any pink boxes or lines!
5.2 Making Rock Unit Polygons
Once all topology errors are fixed, Rock Unit polygons
can be generated.
-
If not already open, open ArcToolbox from
within ArcMap using the button
 in the Main toolbar.
-
Open the "Data Management" toolbox in
ArcToolbox and find the "Feature to Polygon Tool" (Use the
Search window. Forget how? See the
Lab 1 section on this topic). If not already on,
turn on the "Show Help" at the bottom of the tool.
-
The "Input Features" for our new Rock Unit
polygons is the Contacts and Faults(GeolinesXXX)
feature class, the cluster tolerance is 0.001 meter and the
Output should be saved to the Geology Feature Dataset with
the name Rock_Units_XXX, where XXX is your initials.
-
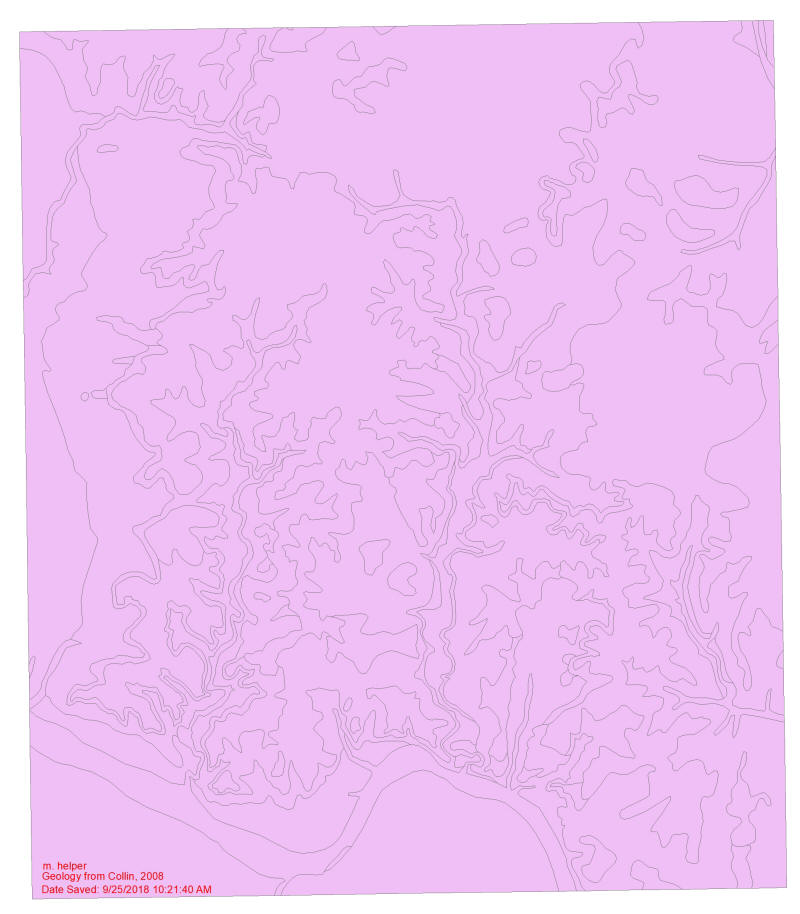
Click OK. The new Rock_Units_XXX polygon feature class is created (shown
below). Not surprisingly, this looks just like
GeoLines_XXX feature class except for the purple
background, indicating these are polygons, not lines.
 5.3
Creating Rock Unit Attribute Fields and Assigning Domains
To symbolize and label rock units, two
additional fields are required, for which we have already
created domains.
-
Using the
procedures in Lab 4, create two new text fields named
"Name" and "Abbrev" for the Rock_Units_XXX
feature class. This does not require a new feature,
simply a new field within the existing feature class.
These can be created either in ArcCatalog, as in Lab 4, or
alternatively in ArcMap by opening the attribute table and
choosing "Table Options" from the icons at the top of the
attribute table window. The "Name" field should have
Length of 50 and use the "Unit_Name" domain; the "Abbrev"
field should have a Length of 5 and use the "Unit_Abbrev"
domain.
5.4
Assigning Attributes to the Rock Unit Polygons
-
Open an empty ArcMap
document and add the GeoLines_XXX and
Rock_Units_XXX feature classes.
-
Add the rectified geologic
map scan and move it to the bottom of the table of contents.
-
Symbolize the Rock_Units_XXX
polygons with "No Color" so you can see the geologic map
beneath them.
-
Set the Selectable layers
to Rock_Units only (turn off selectability for all others).
-
From the Editor toolbar, Start Editing; In
the Create Feature window select Rock_Units_XXX; click the
arrowhead tool (on the Editor toolbar) and click a polygon
on the map to select it. Alternatively, open the
Attribute table and select a record, Zoom to Selected (with
a right-click), and then assign the Name and abbrev from the
drop-down list.
-
SAVE EDITS frequently.
-
When you think you have
attributed all of the polygons, open the attribute table for Rock_Units_XXX and check. The Name and Abbrev field for
all features should not contain any <null> values. If
one does, select the record that contains the null value
(click it), "Zoom to Selected"
(from a right-click on Rock_Units in the table of contents;
can also be done by a double-click on the row in the table),
zoom out, and attribute the polygon.
-
When finished Save Edits
and Stop Editing.
Congratulations, you have now finished
creating/editing the geology feature classes needed for the
geologic map!
-
To symbolize the rock units with
patterns and fills that closely match the
original map, use the "Styles" available
in the Lab_4_data folder. These can be
accessed through the Rock_Units_XXX
Symbology tab and Symbol Selector. Note
the "Style References..." button on the Symbol
Selector, from which one can "Add Style to
List...". Experiment and/or use the Help
files see if you can't figure out how. There
are pre-made colors/patterns for all units.
Importantly, these will have to be altered to show
"no color" for the outlines so that the dashed and
solid geolines can be used for rock unit
outlines (contacts) instead. Pro tip:
if you created your own elaborate symbol or fill,
save it to a Style so it can be used again.
5.5 Clipping Feature
Classes to the Map Boundary
-
If not already open, open ArcToolbox from
within ArcMap.
-
Expand the "Analysis" toolbox, then the
"Extract" toolbox to see the "Clip" tool.
-
Open the Clip tool.
-
Click the folder button next to the "Input
Features" field, browse to your geodatabase and double-click
on contours_5m feature class.
-
Click the folder button next to the "Clip
Features" field, browse to your geodatabase and
double-click on the Area_of_Interest feature class.
-
Name the new file in the "Output Feature
Class" field, and click OK. A new feature class of
contours that are clipped to the map area has been created!
Add them to the map and symbolize using the instructions
below.
-
Repeat steps 3 - 6 for any of the other base
map feature classes needing to be clipped, providing new
names if you wish.
5.6
Symbolizing Streams,
Lakes and
Contour Feature Classes; Labeling Index Contours
-
ArcMap contains ready-made
symbols for many feature classes - use them for the streams,
lakes and roads.
-
To symbolize the
100, 125, 150 and 175 meter contours with a thicker line (as is
the custom on topographic maps; these are called "Index"
contours):
-
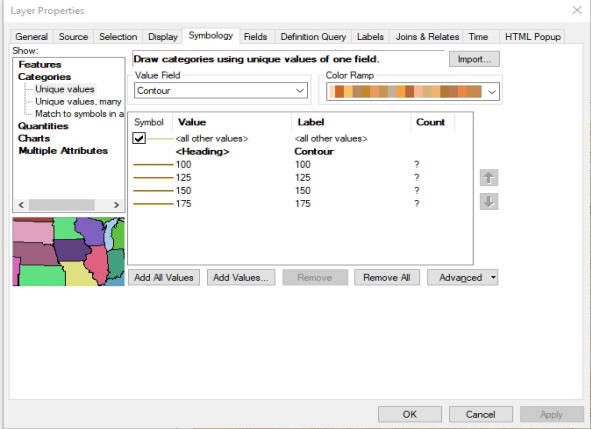
Symbolize the Contour feature
class by Categories;
-
Change the "Value Field" to "Contour";
-
"Add
Values" of 100, 125, 150 and 175;
-
Symbolize these
categories with the "Contour, Topographic, Index" symbol;
-
Change the "all other values"
symbol to "Contour, Topographic,
Intermediate". The result is shown below.
-
Give all feature
classes simple new Layer Names in the Table of Contents (use
the "General" tab in the layer's
Property window) that would make sense in a
legend.
-
To label the Index
contours, you'll need to make a new Label Class (call it
"Index"), and construct an SQL query that limits the
Class
to where "Contour" is equal to the Index contour
values. See
Lab 3 if
you've forgotten how. The
labels should be 10 point, Arial italic with the same color as
the contours, with a 1 point light brown "halo", and a
Placement that allows curving
to follow contours lines. Use the Maplex label engine
for best results.
5.7
Symbolizing
and Labeling the Remaining Layers
The remaining layers should be symbolized and
labeled by the Domain values we entered, e.g. "Exposure" (dashed versus solid line
versus dotted) and "Abbrev" for rock unit labels.
-
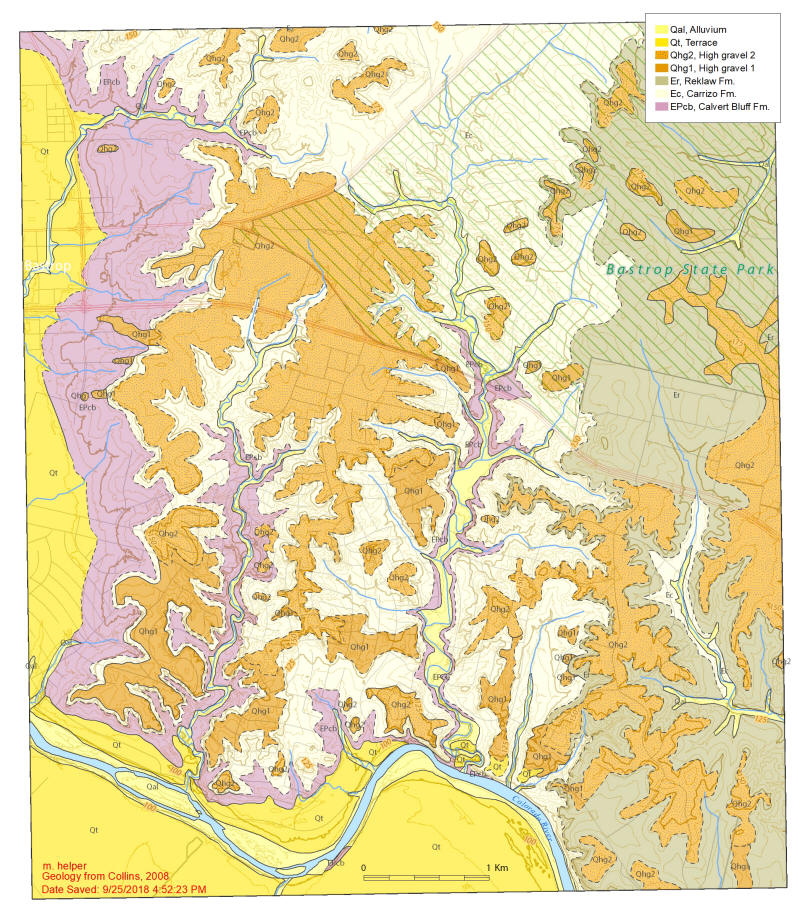
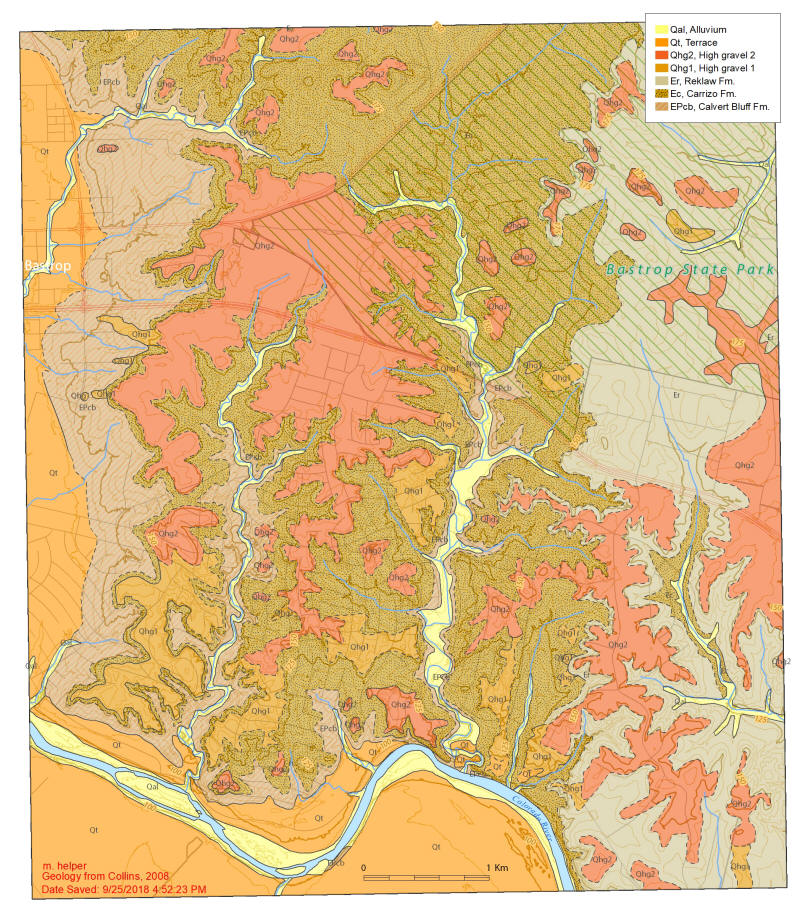
Symbolize Rock Units
without an outline and
with a color/pattern scheme from the GAT style sheets in the Lab_4_data folder
or of colors of your own choosing.
Use your GeoLines_XXX feature class, properly
symbolized, for rock unit outline (contacts). A few examples
are shown below.
-
Label Rock Units with Abbreviations.
Convert dynamic labels to annotations (see
Lab 3) as need for the best placements.
|
|