|
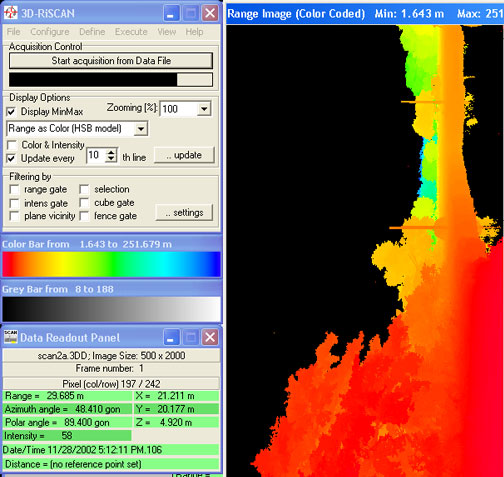
Once a scene is scanned in the field
by the LADAR instrument, there are several steps required to get the data
into ARCGIS. The software that accompanies the instrument
(3D-RiSCAN) can be seen in the image below. The file generated from
a LADAR scan is a "*.3DD" file, and these can be opened in the RiSCAN
software. Once a *.3DD file is opened (a scan from
La Pilita is shown below),
several interesting observations can be made in the data readout panel.
Here, you can observe the pixel dimensions of the scanned image, and get
some idea of the geometry of the scene. If you are to move the mouse
cursor around the range image on the right, you can see data that
corresponds to the particular pixel you are located on. For
instance, in the image below, the cursor must be placed on a pixel
representative of a surface that is oriented some x,y,z value from the
scanner origin (0,0,0). The linear distance to that point can also
be identified. The azimuth angle (pan
axis) and the polar angle (tilt axis)
are measured in gon units (1 gon = 0.899 degree). Other information
regarding the details of the scan can also be seen.
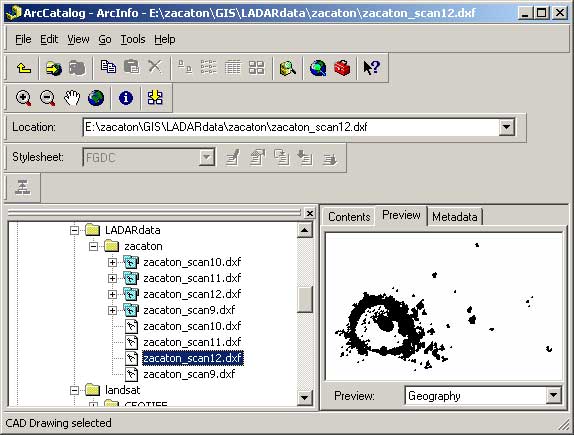
The *.3DD files can then
be exported from the 3D-RiSCAN software in a number of formats.
Since ARCGIS is set up to easily import *.DXF files, that particular
format was chosen for this application. Once the file was imported
to the Sistema Zacaton geodatabase, it could then be viewed in both ArcMap
and ArcScene (using 3D Analyst). Some imported scans from the
sinkhole Zacaton can be seen below, listed in ArcCatalog.
|