|
Goal
GPS data from last weekend's field trip need to be brought into
the GIS project constructed in Lab 10,
merged with other group's data, and
assembled into a geologic map that shows granite outcrops.
Procedure:
The general procedure for lab this week involves the following steps:
- Clean the field data of spurious GPS point and vertices.
Edit your point file attribute table, if necessary, so that joint
strikes and dips are correct;
- Select lines from the class dataset to construct polygons;
- Export/Append those lines to create a single feature class;
- Clean these lines of any self-overlaps;
- Snap the ends of the line segments to create single lines that
entirely enclose areas;
- Using the photograph, digitize new line segments where needed to
enclose uncompleted areas of grass or rock;
- Convert the enclosing line features to polygons;
- For polygons that lie within polygons, subtract the overlying
polygon from the underlying polygon - this step completes
polygon creation and editing;
- Append all joint measurements to form a single feature class;
- Add these three new feature classes (the new lines, the new
polygons, and the new point shapefiles) to your existing GIS from Lab
10;
- Add the GPS-collected polygon files from this year and last
year to the Lab 10 GIS;
- Symbolize the new data to make a map.
We won't be creating a topology because the outcrops are not
topological features with respect to the rest of the map - they can
simply lay on top of the geologic map we already have, violating the
topologic principle of all areas summing to the entire area of the map.
Our ultimate goal is determine the area of rock versus non-nock within
the bounds of the WMA, and a topology is not needed to do so.
11.1 Getting Started
- Download the Lab_11_data folder to your network storage space.
This folder contains subfolders of each group's field data in the
form of point, line and/or polygon shapefiles.
- Load the line files, one at a time, into the GIS you created in
Lab 10. After loading a line file, edit it to delete or move any
spurious vertices. Don't forget to set the task on the editing
toolbar to "modify feature" and the target to the layer of
interest, and be sure the layer is selectable. See
lab 5 if you've forgotten how to do
this. Save your edits.
- Load the point shapefiles, one at a time, examining the
attribute table for each to be sure that the strike and dip
fields have meaningful values. Some datasets may have
joint strike values stored in the comment field (drop down menus
didn't work in the field). Others may have strike values
of 000, a suspicious if not implausible value. Some of the
dips will also be given as 0; these should be changed to 90
unless you know for certain they are not joints. Edit such
tables so that the strike and dip fields are correct and save
your edits. Note: I have edited some of these files
already; please use the files in the Lab_11_data folder
and not copies you may have of your own data.
11.2 Selecting, Cleaning and Merging Lines
- Create a new folder in your Lab_11_data folder to store data created by the steps below... call it
something like "Appended _files".
- Using ArcCatalog, copy the "MH_line_08" and
"MH_Points_08" shapefiles into the new
folder - these will be the shapefiles to which all other line
and point files will be appended. Rename the copied MH_line_08
and MH_point_08 files to
another name of your choosing (e.g. "Best_lines" and "Best_points") so that
they
can't be confused with the originals.
- Load all of the edited line data from step 3 above and the
new "Best_Lines" shapefile into an empty ArcMap project; load
the orthophoto from Lab 10.
- Using an ArcMap selection tool of your choice, select the
line segments from the dataset that you think are the best
representation of the edge of the granite outcrops. You will
construct polygons from these lines, but we first need to isolate
and save a subset to work with; many of the lines duplicate the
same traverse, some showing more detail than others. You
will most likely want to use your own data (?) for the areas you
covered, but will need other team's data to complete the
picture. The easiest (?) way to do this is to start with a
single area where multiple segments duplicate the same contact
and select one that you think is best, keeping in mind that it
can be modified by snapping to other lines, adding vertices,
subtracting vertices, splitting a line (see the help file on the
split tool), etc. It may actually be easier to delete the
segments you don't want by editing the files individually, but
be careful not to delete segments you will later need if you
change your mind. It should go without saying that you
will not be able to honor everyone's data.
- Once a line or lines are selected from one of the shapefiles, the Append tool can be
used to copy the line(s) to the "Best_lines" shapefile.
- Open ArcToolbox from within ArcMap, open the Data Management
toolbox, open the "General" toolset and open the Append tool.
- Read the Help file on the Append tool.
- With one or more
lines selected from a SINGLE shapefile, use the Append tool to
add the line(s) to the "Best_line" shapefile. Continue
this process until you have Appended all of the lines needed to
enclose the grass or outcrop areas that were mapped (or
partially mapped).
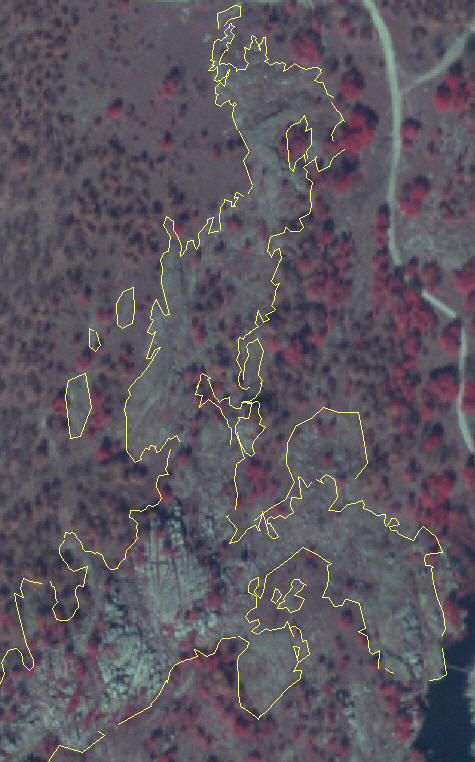
Below are a few screen captures that
show my attempt to do this with data collected during a
different trip (Spring, 2007). When looking at these, keep in
mind that I used parts of lines selectively by splitting lines
with the split tool and deleting parts of segments that repeated
other lines that I liked better. It is harder to recognize
individual line segments in the lower image because the next
step, snapping line segment ends to one another, has already
begun.

-
Clean the line segments of any self-overlaps or
overlaps with other lines and snap dangling segments to each other.
Do this methodically; all segments that are continuations of a
single line MUST BE SNAPPED and all overlaps must be removed by
deleting the appropriate vetices! Some segments that have no mapped
continuation can not be closed; leave these as they are for now.
-
Use the Merge tool from the Editor toolbar drop-down
menu to merge the snapped line segments into single lines.
Make sure that the "Preserve overlapping segments" in the merge
widow is turned off each time before you do a merge. The
goal is to merge all adjacent segments into a single feature; i.e.
what was once many records in the attribute table becomes a few
records. A red vertex anywhere on a line segment except at the
end is an indication that the line overlaps itself or is not snapped
to an adjacent segment. N.B. If you see a red vertex after
a merge, undo the merge or, with the line selected, use the Explode
tool (on the advanced editing toolbar) to deconstruct the multi-part
feature you created by merging (see the Help file on the Explode
multi-part feature tool) and fix the problem, then merge again.
SAVE EDITS OFTEN.
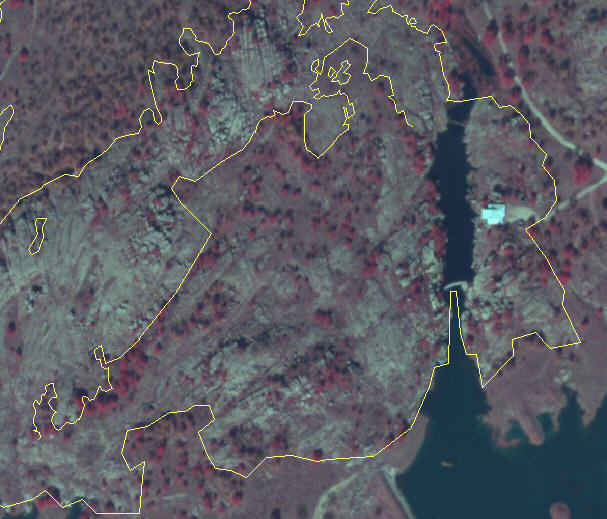
-
When you think you have merged all contiguous lines,
open the attribute table and select each record in turn. If
the selection is not visible on the map, then from the Selection
menu "Zoom to Selected" to find the selected line. Every
record in the table should correspond to a closed line or an
intentionally dangling line. If not, fix the problem by
deleting the offending record (only if it is an artifact created by
a previous merge) or by deleting the offending vertices and merging
again. The screen capture
below is an example of the finished merged lines. There are 13
lines on this figure: 10 small closed lines (some too small to see),
two large closed lines, and one intentionally dangling line.
SAVE ANY EDITS.

11.3 Digitizing new lines to complete
dangling lines
Enough data were collect that only a few areas
were left with dangling lines. In Spring, 2007 trip, the NW contact of
a
vegetated region within granite was partially mapped but dangles at both ends, as shown in the
center of the photo below. The uncompleted rest of the vegetated
area can be mapped from the aerial photo.
We would like to symbolized photo-interpreted contacts
with dashed lines. To do so, we will use the symbol field in the "Best_lines"
attribute table to denote the line symbol.
-
If not already done, edit the symbol field of the
attribute table so that all existing lines have the attribute
"solid", and change all values in the LINE_TYPE (or "LN_TYPE") field to "GPS", as
shown below.

-
Being sure that you have snapped the cursor to one
of the dangling ends, digitize a line that completes the
enclosure of what looks vegetation or granite in the aerial photo. Finish
by snapping to the other dangling end. Don't be too picky,
it's only a guess.
-
Attribute the new line with a LINE_TYPE of "photo" and
SYMBOL of "dashed". DO NOT merge the new line with the
existing contact. SAVE EDITS.
11.4
Creating polygons and subtracting overlapping areas
-
Open the Data Management toolbox, the Features
toolkit, then the "Feature to Polygon" tool.
-
Use this tool to create a polygon feature class,
accepting the defaults settings for all but the output location and
file name. The process of creating polygons from lines will
fail if: 1) the ends of all lines in the merged features are not
precisely snapped to one another, 2) contain coincident vertices, or
3) contain line segments that cross one another. If
polygons are not created from all lines, go back and examine
the lines, making corrections where needed. Lines will have to
be "unmerged" (using the explode tool on the advanced editing
toolbar), then carefully checked, vertex by vertex, to find the
offending vertices or segments.
-
Once created, polygons that fall within polygons, e.g. a grass
polygon within a granite outcrop polygon, overlap one
another. We would like to cut a "donut hole" through the
granite outcrop polygon so that the hole exposes the layer beneath
it, in this case the aerial photo.
-
To do so, set the target on the editing tool bar to
the new polygon shapefile, set the task on the editing toolbar to
"Modify Feature" and make the new polygon file the only selectable
layer. Then (and only then) select one of the grass polygons
that lies within granite and, from the Edit toolbar drop down menu,
select "Clip...". Accept the defaults and press OK.
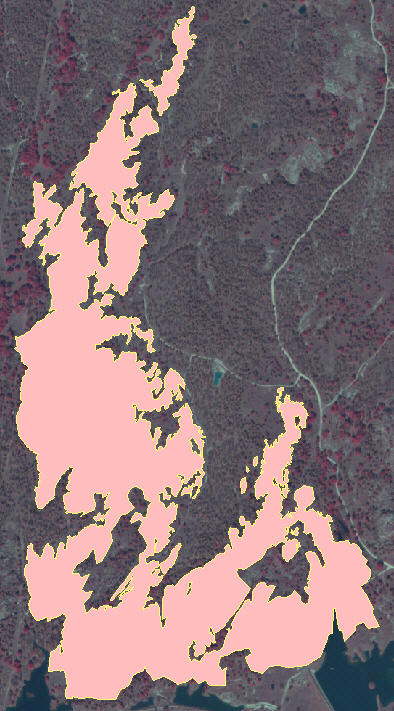
-
If not still selected, select the same polygon again
and delete it. This will leave a hole in the granite polygon.
Repeat the process for all polygons within polygons, to give a
result like that shown below.
11.5 Merging the point data
-
After editing the point data files, append all of
them to the "Best_point".
-
Add the "Best_points" shapefile and the remaining
point shapefiles to the map.
-
Edit the attribute table so that PT_TYPE field
contains the attribute "joint" for all joint measurements and
"other" for any thing else. SAVE EDITS.
11.6 Create a new map
-
Open the Lab 10 GIS and add the "All_points", "Best_lines"
and the new granite polygon shapefile. Arrange these files at
the top of the table of contents so that the point file is above the
line file which is above the polygon file.
-
Symbolize these new layers appropriately, using the
proper strike and dip symbol for the joints and a slightly different
shade of red than that of the granite on the map with no outline,
and a dashed and solid line for the Best_lines granite contacts.
-
If not already there, add the existing granite
outcrop polygons from the Lab_10_data
folder ("All_outcrops_06_07"), and the existing point file
("All_points_06_07). Symbolize these to
match those of step 2 above.
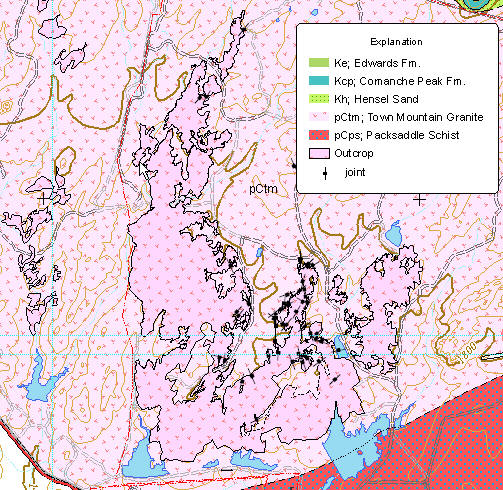
-
Create a page-size layout of the area containing the
mapped granite outcrops. A partial sample is shown below.
To Turn In:
The layout described in step 4 above.
You're Done!
|
 |